Drawing Tool
Guidance on how to use the 'Drawing Tool' on the Risk Intelligence System. This includes information on the various types of drawings available, and how to use the function in practice.
Watch our video
Read our article
On the Risk Intelligence System, a drawing is an area mapped out by a user.
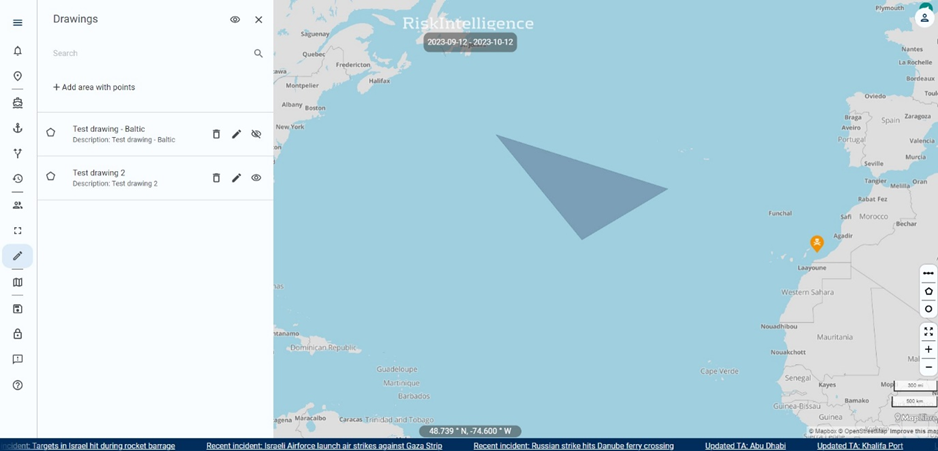
The 'Drawing Tool' is used to create these areas and is accessed either by clicking one of the drawing tool icons in the right side of the screen, or by opening the menu item 'Drawings', on the left of the screen.
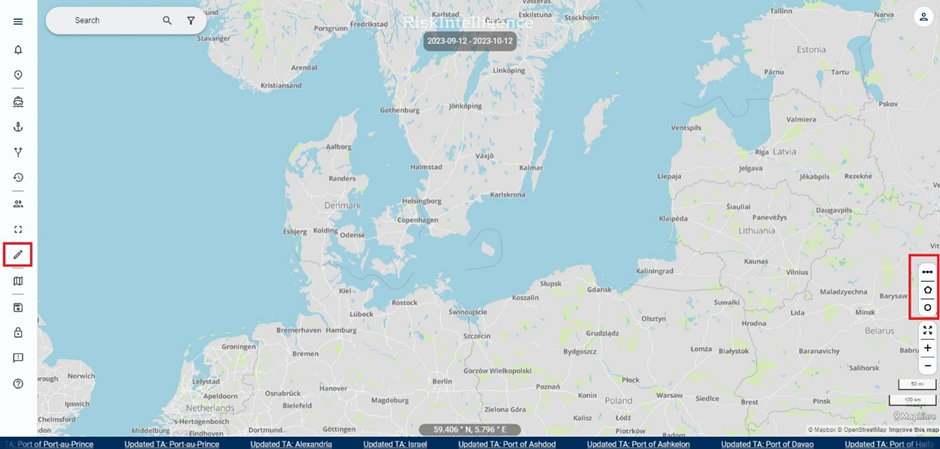
There are three types of drawing tools available:
- Line tool - Select a starting point on the map, and an end point. This will automatically finish the drawing.
- Polygon tool - Select a starting point and click the map to start drawing. When you are satisfied with the shape, click the first or last point to finish the shape.
- Circle tool - Select a centre point, click, and drag the circle out until it has the appropriate radius. Please note that depending on the latitude and the location of the circle on the map, the circle be eschewed because of the map projection.
When a drawing is finished, a menu section will open, where you can see the overall data on the drawing, and you can save the drawing. You need to enter both a name and description, and then press 'Submit' in the bottom of the menu to save the drawing.
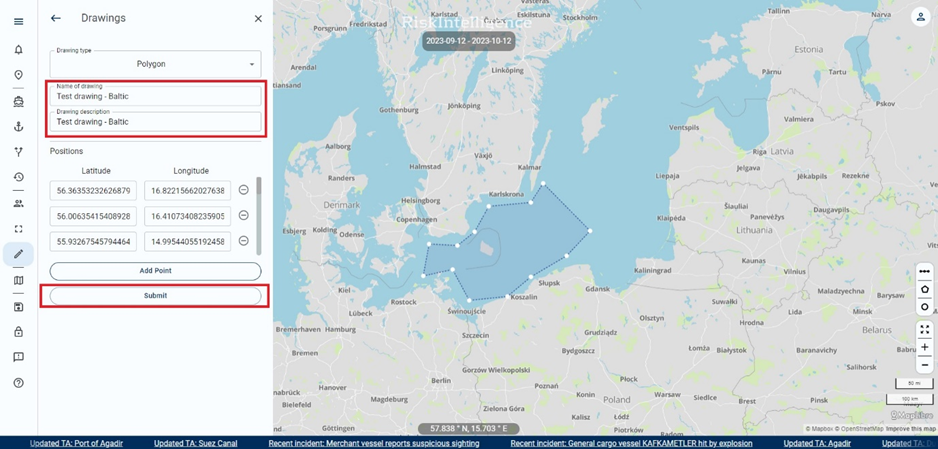
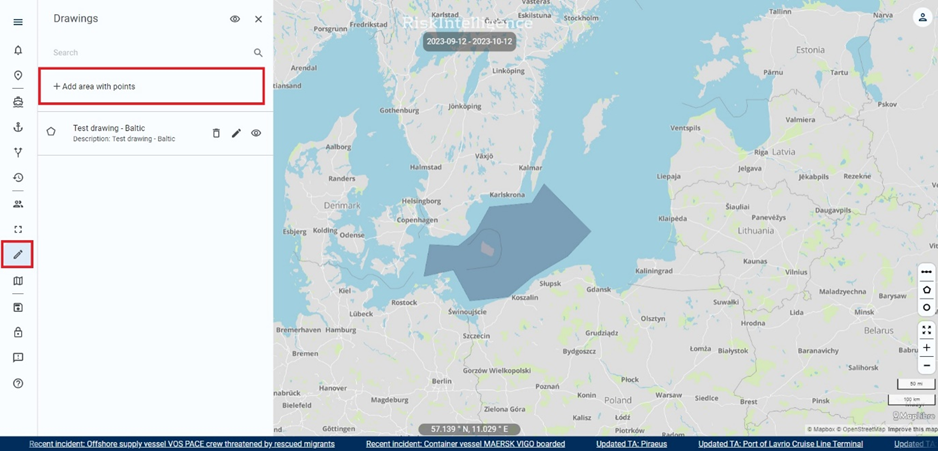
The drawing will now be present in the 'Drawings' menu and can be toggled on and off.
It is also possible to manually type in the data for a drawing, and create it that way.
To do so, enter the 'Drawings' menu in the left side of the screen, and press 'Add area with points'
Here you can choose between the three types of drawing, and manually insert the latitude and longitude data you want the drawing to have.
Please note, that the format for latitude and longitude must be written in decimal degrees (from 0 to 15 decimals after the decimal point).
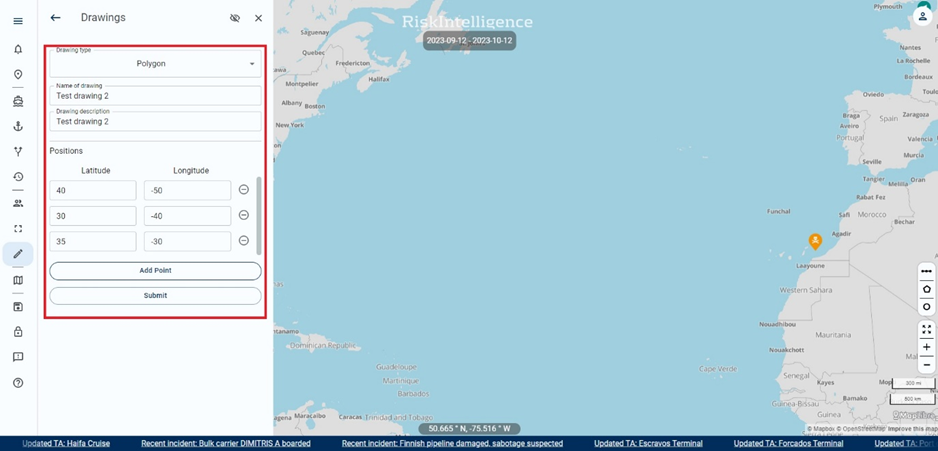
Once the information has been filled in, press 'Submit', and the drawing will be saved in the system.
The drawing tool also includes a colour line feature. Users can now choose a colour and adjust density for their drawings, providing more flexibility and customization options. This feature is accessed simply by pressing the paint icon in the red circle as indicated below.
